'95-'99 PC Comparisons
In an attempt to compare Personal Computer (PC) technology from November of 1998, when the Sega Dreamcast launched in Japan, through March 2000, when the Playstation 2 (PS2) launched in Japan, 3DMark 2000 and 2001 results will be posted in a multi-part comparison feature. The test PC specifications are as follows:
 P2B, P3B-F
Intel 440BX based Motherboards 1 2
| Lifespan: | 1998-2002 (P2B), 1999-2002 (P3B-F)3 |
|---|---|
| CPUs Tested: | Slot 1: Celeron 300A, PIII 500, PIII 800E (P3B Only) |
| CPU Cache: | 300A: 32KB L1, 128KB L2 PIII 500: 32KB L1, 512KB L2 PIII 800E: 32KB L1, 256KB L2 |
| Co-Processors: | BIOS: Award Modular 4.51PG (P2B) & Award Medallion 6.0 Revision 1008 Beta 004 (P3B-F) Intel 82440BX ISA/PCI/AGP Set: 100Mhz Front Side Bus (FSB) North Bridge:
Intel 82443BX
South Bridge:
Intel 82371EB PIIX4E IDE Controller:
Intel 82371AB/EB PCI Bus Master IDE PCI Add-Ons: Promise Ultra133 TX2 IDE
3Com EtherLink ISA Add-Ons:
Creative SoundBlaster Awe64
|
| Video Cards Tested: | AGP/PCI: Matrox Mystique 220 8MB, Matrox M3D 4MB PowerVR PCX2, Diamond Monster 3D Voodoo 4MB, Nvidia Riva TNT 16MB, 3dfx Voodoo 3 3500 16MB, Diamond ViperV770 TNT2 Ultra 32MB, Geforce 256 32MB, GeForce2 MX/400 32MB, Hercules 3D Prophet 64MB, Ati Radeon 7500 64MB |
| Test Resolutions: | 640x480, 1024x768 |
| RAM: | 256MB P2B, 320MB P3B-F PC100 |
| RAM FSB Bandwidth: | 64-bit, 800MB/s |
| Video RAM: | 8MB-64MB |
| Video RAM Bandwidth: | |
| Audio RAM: | 8KB |
| Colors On Screen: | VGA 8-bit, 16-bit, 32-bit RGB |
| Storage: | Floppy Drive: GENERIC NEC Disk Drive: MAXTOR 6 L080L4 (80 GB, 7200 RPM, Ultra-ATA/133) 4 Optical Drives: NEC NR-7900A (24x/10x/40x CD-RW) LITEON DVD-ROM LTD163 (16x/48x DVD-ROM) |
 500:
500:
Intel Warm Springs 440BX Proprietary PC
| Lifespan: | 1999-2000 5 |
|---|---|
| CPUs Tested: | Slot 1: PIII 500 |
| CPU Cache: | PIII 500: 32KB L1, 512KB L2 |
| Co-Processors: | BIOS: PhoenixBIOS 4.0 Release 6.0 4W4SB0X0.15A.0012.P07 Intel 82440BX ISA/PCI/AGP Set: 100Mhz Front Side Bus (FSB) North Bridge:
Intel 82443BX
South Bridge:
Intel 82371EB PIIX4E On Board Audio:
Ensoniq Tabor2 PCI Add-Ons: Promise Ultra133 IDE
Realtek RTL8169/8110 Family Gigabit Ethernet ISA Add-Ons:
|
| Video Cards Tested: | AGP/PCI: Matrox Mystique 220 8MB PCI Nvidia Riva TNT 16MB 3dfx Voodoo 3 16MB Diamond ViperV770 TNT2 Ultra 32MB Nvidia GeForce 2 MX/400 32MB Ati Radeon 7500 64MB |
| Test Resolutions: | 640x480, 1024x768 |
| RAM: | 256MB PC133 @ 100Mhz 1 256MB SDRAM DIMM |
| RAM FSB Bandwidth: | 64-bit, 800MB/s |
| Video RAM: | 8MB-64MB |
| Video RAM Bandwidth: | |
| Audio RAM: | 64 KB |
| Colors On Screen: | VGA 8-bit, 16-bit, 32-bit RGB |
| Storage: | Floppy Drive: GENERIC NEC Disk Drives: WDC AC31 3500D (13.4 GB, 5400 RPM, EIDE) 6 WDC WD10 2AA (10.2 GB, 5400 RPM, EIDE) 7 Optical Drive: HP CD-Writer+ 9300 (10x/4x/24x CD-RW)
|
Video Comparisons and Benchmarks
Here are some videos of PC benchmarks from '98-'99 hardware. They were recorded in an ongoing process to document all of the hardware, and their respective performance, owned locally. Eventually this may result in a comprehensive video comparison or each CPU and Graphics card that has been archived here, along with a comparison when applicable to Console ports of the same games.
- 1. Asus P2B Manual
- 2. Asus P3B-F Manual
- 3. Span from initial release year to year of final bios revision.
- 4. http://www.seagate.com/support/internal-hard-drives/desktop-hard-drives/...
- 5. Span from initial release year to year of final bios revision.
- 6. http://www.wdc.com/en/products/legacy/Legacy.asp?r=1
- 7. http://www.wdc.com/en/products/legacy/Legacy.asp?r=2
Windows 98SE PC Benchmarks
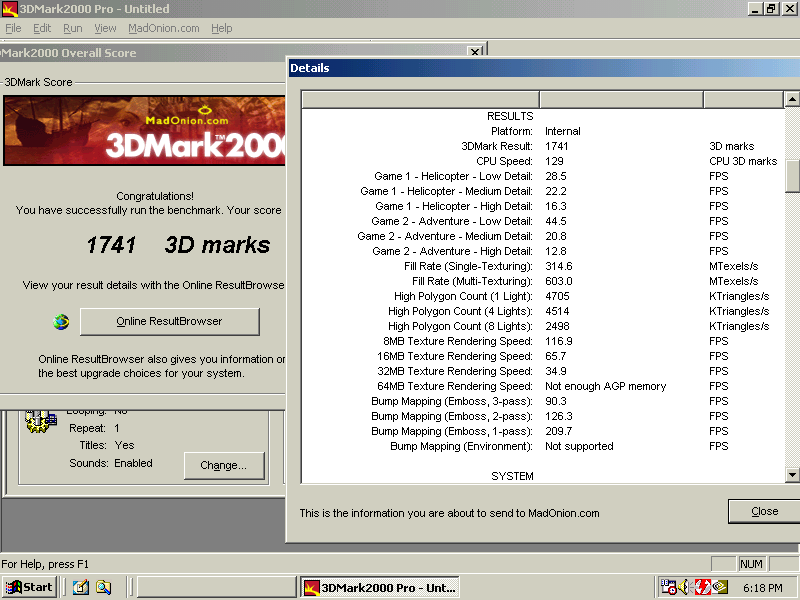
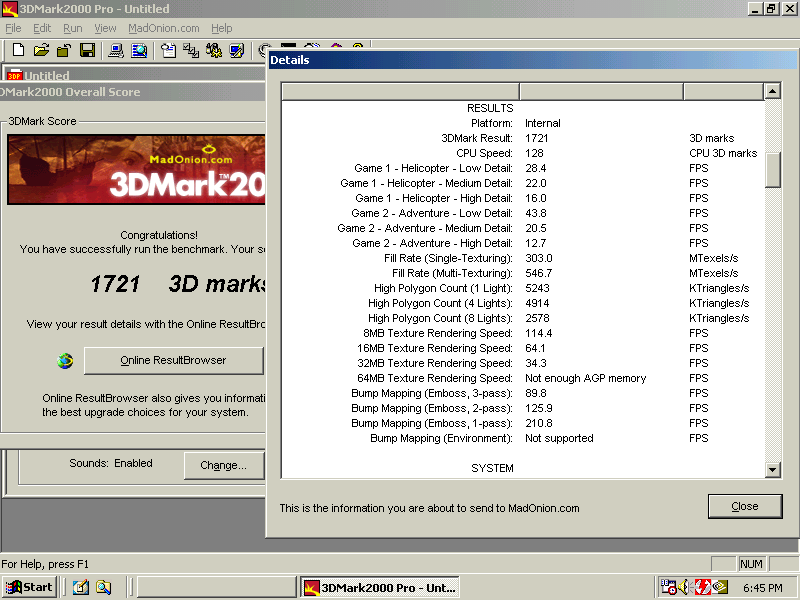
3DMARK 2000 Benchmarks
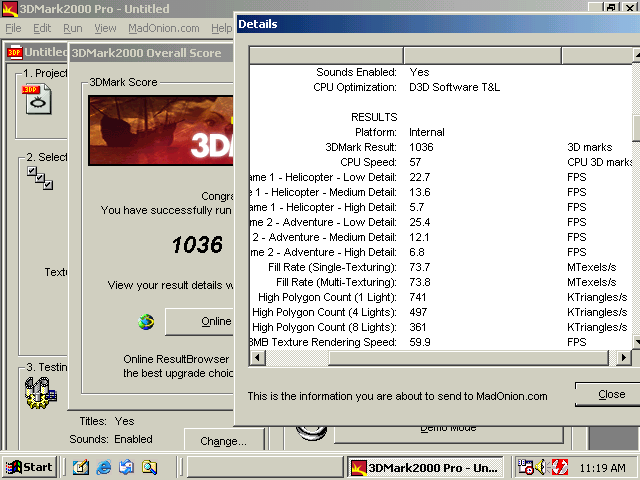
3DMARK 2000 systematically tests the CPU and Graphics Card with a series of in game and theoretical tests. The results are charted below and each graph is organized chronologically by CPU and then GPU. All of the hardware listed was released from late 1998 to the end of 1999 with the exception of the Geforce 2 MX, Radeon 7500 and Kyro II. These graphics cards were included to show whether later GPU developments created a significant performance gap between top of the line PCs and, then, current generation game consoles.
Stats for the Helicopter Test:
Detail Level |
Objects | Lights | Triangles | Vertices | Textures |
|---|---|---|---|---|---|
| Low | 23 | 4 | 6,997 | 11,601 | 2.74 MB |
| Medium | 37 | 5 | 13,520 | 22,875 | 2.87 MB |
| High | 39 | 5 | 53,026 | 71,292 | 2.81 MB1 |
Click for full size chart:
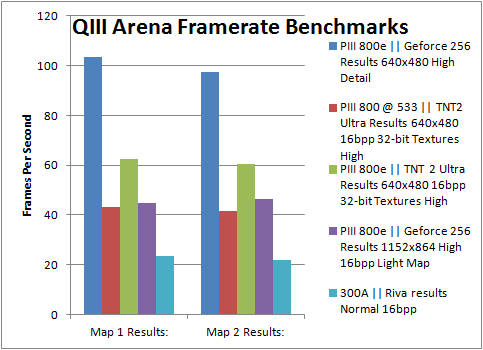
Average statistics for the Helicopter test's low mode is 23 Objects, 4 Lights, 6,997 Polygons, 11,601 Vertices and 2.47MB of Textures, while high detail averages 39 Objects, 5 Lights, 53,026 Polygons, 71,292 Vertices and 2.81 MB of Textures.2. Early Dreamcast/Naomi games like Incoming, Crazy Taxi and Sword of the Berserk ran at a solid 30FPS with comparable geometry and at least as many objects and animated characters on screen.3 Yu Suzuki is on record repeatedly citing peak Dreamcast polygon performance in game at 3.5 million polygons per second. Some evidence exists that this figure was an estimate based on prototype Blackbelt or Dural hardware.
More importantly for the present comparison, 3.5 million polygons per second at 30 frames per second is only 116,000 polygons per frame. One Hundred and Sixteen Thousand polygons per frame at 40 bytes per polygon is 4.45 Megabytes of precious Video RAM, or a little over half of the 8MB attached to the PoverVR 2 - DC. Suzuki-San's estimation of the Dreamcast's peak in game performance may have been based more on VRAM limitations than anything else. Final Dreamcast hardware, and VRAM requirements for a 16-bit color 640x480 frame buffer being less than 0.7MB,4 leave ample room for the Dreamcast to maneuver.
Stats for Adventure Test:
| Detail Level | Objects | Lights | Triangles | Vertices | Textures |
|---|---|---|---|---|---|
| Low | 22 | 4 | 9 392 | 16 356 | 3.14 MB |
| Medium | 33 | 7 | 17 084 | 24 023 | 3.31 MB |
| High | 44 | 8 | 29 941 | 36 983 | 3.41 MB5 |
For the Adventure test we have a range of 23 to 39 objects and total polygon vertices ranging from 16,356 to 36,983 polygons per frame.6 Of particular note here, there is no consistent conversion in either the Adventure or the Helicopter test between how many vertices make up a specific number of polygons. One cannot simply divide the number of vertices by three, or any other number, to get the number of polygons.
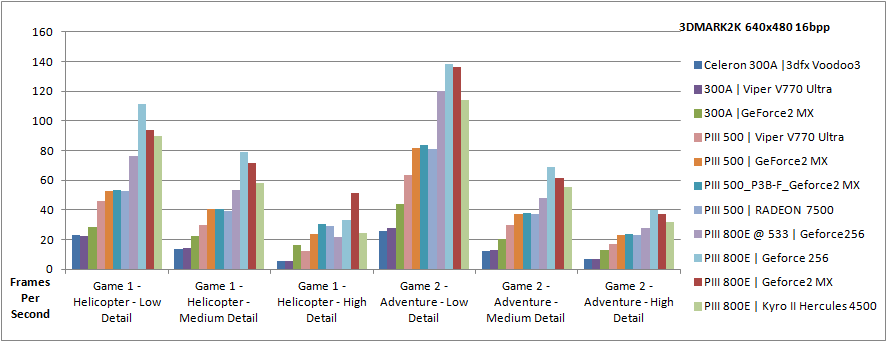
Video RAM usage for textures, excluding frame buffer, is fairly consistent at just below 3.5MB. Using these two tables it is possible to combine the framerates graphed above to find the "in game" polygons per second specs for each CPU and Graphics Card according to 3DMARK 2000. Since these game demos are more graphically advanced than anything that was released in 1999-2000 these averages are significant especially when compared to 3DMARK's own high polygon count test below. Numbers of light sources, and increased polygon detail in general, tends to have a dramatic affect on framerate, if not peak polygon throughput, even with graphics cards from 2000 and 2001 like the Geforce 2 MX, Radeon 7500 and Kyro II.
Click for full size chart:

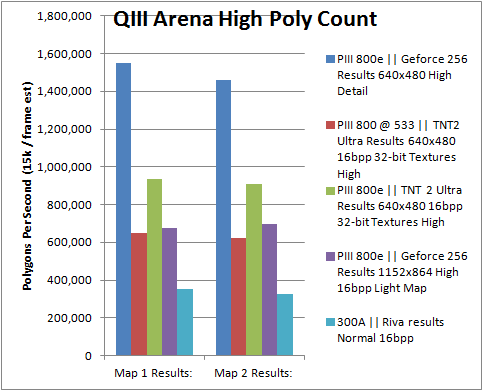
Maximum Dreamcast polygon counts, assuming one light with modifier volumes for shadows, is between 5-6 million polygons per second.7 Dreamcast's PowerVR 2-DC is the hard limit, based on 640x480 resolution frame buffer and 40bytes per polygon filling the 8MB of VRAM.8 The Hitachi SH-4 can set up over 10 million polygons per second.9 Melbourne House claimed 5 million polygons per second with all weather effects and cars on screen with Test Drive Le Mans.10 Current best guess average polygons per second for Le Mans is 300-500 thousand polygons per second.11
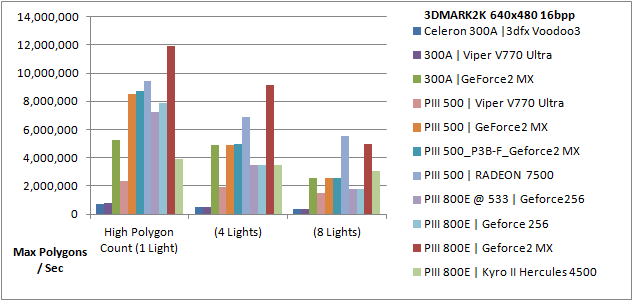
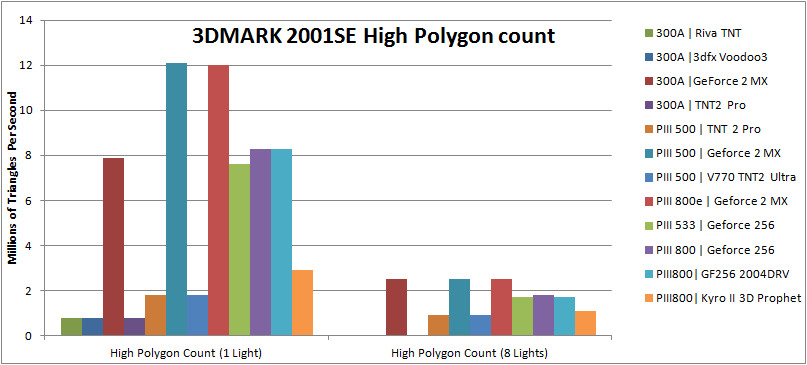
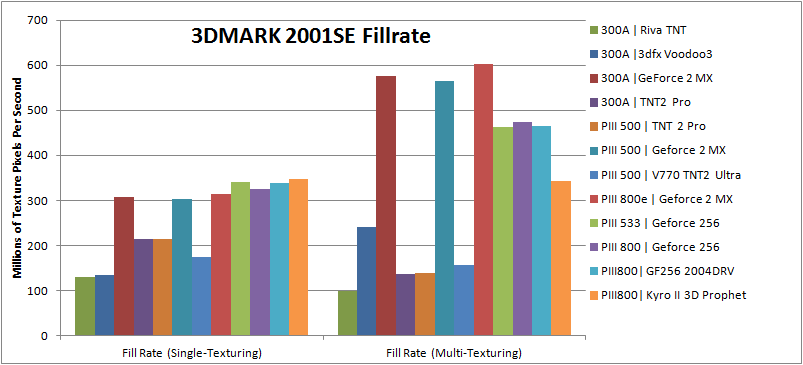
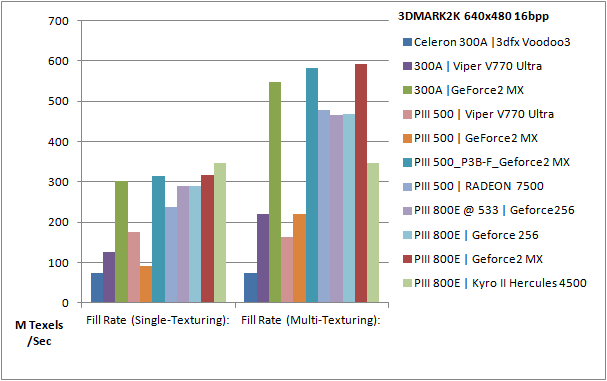
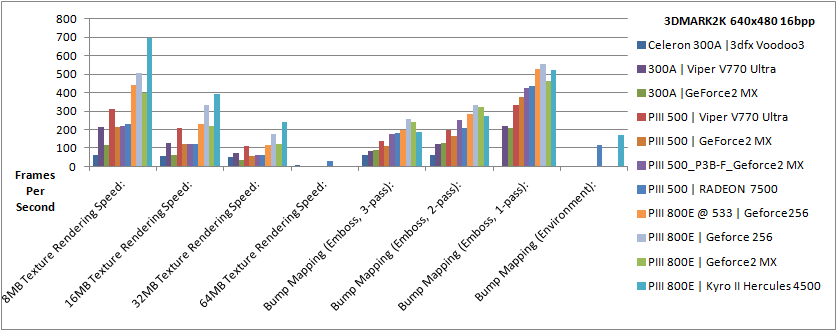
3D Mark's High Polygon Count tests are more realistic than theoretical peak performance figures, but still not as low as in game performance was. As can be seen here, the Pentium III 800e and Geforce 256 peak out at 8 million polygons per second with one light, 3.8 million with four lights or less than 2 million with rarely used in game eight lights. The PIII 800e and Kyro II Hercules 4500 (Power VR Third Generation) was tested since a Dreamcast quality PowerVR Neon 250 was unavailable. The Kyro II should outperform the Dreamcast's PowerVR2-DC in all respects and as can be seen further down has more robust multi-texturing effects than what 1998 video cards like the Riva TNT had available.
The PowerVR Second Generation was marketed directly against Nvidia's 1998 Riva TNT and was finalized and released around the same time.12 It is presently unknown if the above peak polygon numbers are only reflecting the Power VR's Tile Based Rendering of only front facing visible polygons. If the traditional renderers are counting back facing and hidden polygons while the Kyro II is only reporting visible polygons these numbers are not representing the same thing at all and the actual performance figures are closer than they appear. Nevertheless, the Kyro II maintains a consistent 3-4 million polygons per second scaling up much less dramatically from eight down to one light. Even the year 2000 released Geforce 2 MX drops to nearly one-fourth the polygon performance from one light to eight. So it is worth noting that the Kyro II maintains two-thirds of its peak performance even with eight lights.13 It will be very interesting to test the PowerVR Second Generation Neon 250 as soon as it can be purchased.14
 2000-2002 Playstation 2 games averaged 1.5 million polygons per second, 300k minimum to 4.5m max, at 25-30 frames per second or less according to Sony's "How Far Have We Got" document.15 Melbourne House boasted 11,000 polygon car models in Grand Prix Challenge, released in 2003. Grand Prix Challenge peaked with 22 car models using 11,000 polygons each, or "20,000 (polygons) with multipass effects," and 500,000 polygons on the most detailed tracks at 60FPS.16 Level of Detail (LOD) changes as objects are displayed further from the camera, so there would never be a single scene with all 22 cars displaying their full detail models. These models are nonetheless impressive in their full detail. One car model out of twenty-two on screen has more polygons than an entire low detail frame in 3DMARK 2000's game tests as can be seen in the tables above.
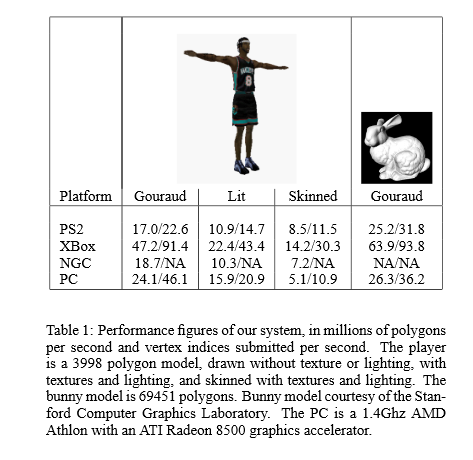
Electronic Arts Canada was able to benchmark the PS2, Xbox, Gamecube and PC tech from 2002 using a Middleware engine. As can be seen, the PS2 peaks at 17 million polygons per second for a texture mapped gouraud shaded model, 10.9 million for the same with presumably one light, and 8.5 million for a skinned model. A non-textured, gouraud shaded but non-lit, high polygon model peaked the PS2's polygon performance at 25.2 million polgons per second.17 These are not in game figures and should not be considered the same as 3D Mark's High Polygon Count test as it still has Windows and Direct X overhead affecting performance. Additionally, Electronic Art's benchmark is not the same as 3D Mark 2000's because it is only measuring how fast the single figure can be rendered. If the figure was rendered ONCE in so many nanoseconds, then the maximum number of polygons per second must be the same multiplied by some guess at frames per second. This model fails to consider AI, Input Output, Physics calculations, or stalls and hardware glitches or poor coding as were mentioned of Sony''s "Graphics Synthesizer" and Vector Units earlier.
Unknown sources in the "mod community" compiled a list of character and car models for the PS2, Gamecube, Xbox, PS3 and Xbox 360. The so-called "6th generation" consoles tended to have 2,000-4000 polygon models including top tier racers like Gran Turismo 3 and GT4, while maximum detail characters were made of 7,000-10,000 polygon models.18 Disregarding this forum poster's lack of sources, Melbourne House's achievement with Grand Prix Challenge should not be taken lightly. The bottleneck prior to 2003 was stalls and lack of proper utilization of the PS2's Vector Units (VU1 and VU0). VU1 would stall on "large polygons and textures" and few games used VU0 at all.19 In addition, a glitch in the PS2's "Graphics Synthesizer" resulted in the system being incapable of proper Anti Aliasing and the limited 4MB cache only allowed the display of a line doubled 640x224 or 640x448.20
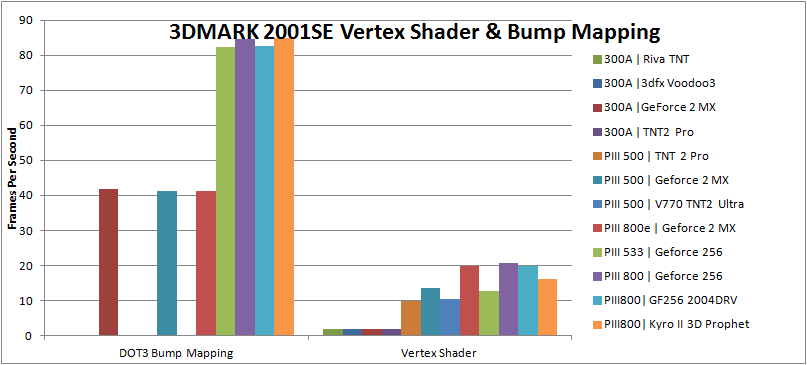
Compared to the Dreamcast's VGA ready 640x480 display, the Graphics Synthesizer's limitations created a very noticeable image quality gap between PS2 graphics and any other contemporary hardware. Number of lights per scene favor the PS2 over the Dreamcast, but not the PC, Xbox or Gamecube. Advanced lighting techniques and other effects are evident in PS2 games especially after 2003 when Sony and Polyphony Digital released their "performance analyzer." Advanced lighting effects and simulated bump mapping were achieved on PS2 by layering polygons on top of the base models to simulate multi-pass effects. Complex Microcode for the Vector Units was required to simulate these effects that were built in to most GPUs from 1998 onward, including those used in the Dreamcast, Xbox and Gamecube.
Click for full size chart:
3DMARK 2000 Results:
- 1. 3DMark Help: Game Test 1 Statistics Average in View Cone, NVNews.net, (archive.org June 6, 2000).
- 2. 3DMark Help: Game Test 1 Statistics Average in View Cone, NVNews.net, (archive.org June 6, 2000).
- 3. Record gameplay for each
- 4. Memory in MB = (X-Resolution * Y-Resolution * Bits-Per-Pixel) / (8 * 1,048,576), available from http://pcguide.com/ref/video/modesBuffer-c.html
- 5. 3DMark Help: Game Test 1 Statistics Average in View Cone, NVNews.net, (archive.org June 6, 2000).
- 6. Vertices are the locations in 3D space of all three points of a triangle. Vertices can and will be shared by adjoining polygons, and polygon "fans" can further reduce how many vertices are needed per object."
- 7. IEEE Micro Dreamcast, (June 5, 2015, archive.org June 14, 2008), available from http://goodcowfilms.com/farm/games/news-archive/IEEE%20Micro%20-%20Page%202.htm.
- 8. "Fill Rate and Memory Bandwidth," (September 27, 2013, archive.org September 27, 2013), available from http://www.ping.be/~pin10741/fillbandw2.htm.
- 9. IEEE Micro Dreamcast, (June 5, 2015, archive.org) available from http://goodcowfilms.com/farm/games/news-archive/IEEE%20Micro%20-%20Page%202.htm.
- 10. Test Drive Le Mans Reviews - Moby Games, (April 19,2015, archive.org), available from mobygames.com.
- 11. "Crazyace," (3-24-2014, Sega-16 Forums).
- 12. "Tom's Hardware Guide VideoLogic Neon 250 Review", (September 29, 1999), available from http://www.thg.ru/graphic/19990929/print.html.
- 13. "Fill Rate and Memory Bandwidth," (September 27, 2013, archive.org September 27, 2013), available from http://www.ping.be/~pin10741/fillbandw2.htm.
- 14. Anandtech Kyro II 64MB Review, (May 15th, 2013, archive.org) available fromhttp://www.anandtech.com/show/735/4.
- 15. "How Far Have We Got?" (Accessed 12-26-2015), Sony Computer Entertainment Europe 2003, 13.
- 16. Melbourne House Q&A, (July 26, 2015, Archive.org), available from http://www.gamespot.com/articles/melbourne-house-qanda/1100-2912020/.
- 17. Paul Lalonde, Eric Schenk, Shader-Driven Compilation of Rendering Assets, Electronic Arts (Canada) Inc 2002, 720.
- 18. "cookepuss," (4-29-2015, GameArtisans.org Forums).
- 19. "How Far Have We Got?" (Accessed 12-26-2015), Sony Computer Entertainment Europe 2003, 14.
- 20. "rusty," (3-24-2014, Sega-16 Forums).
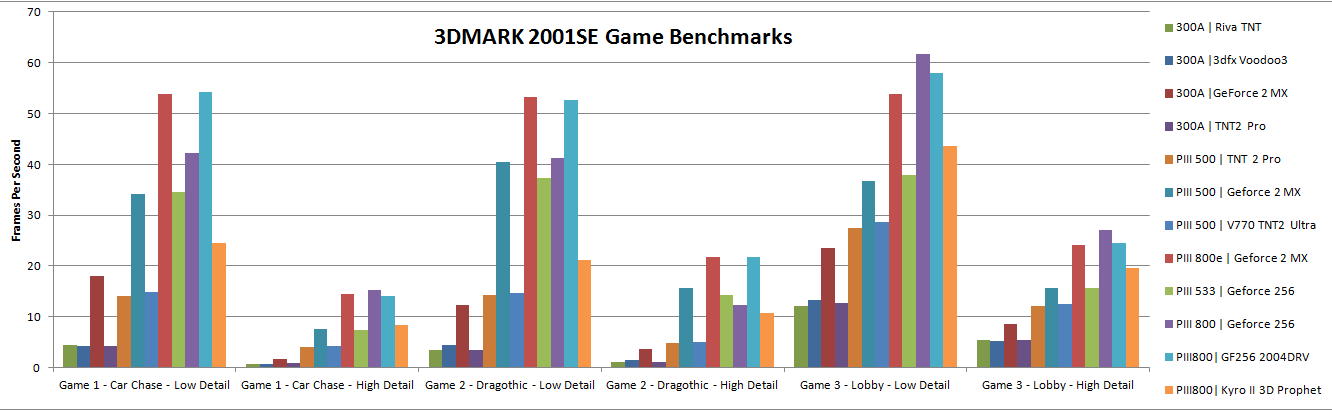
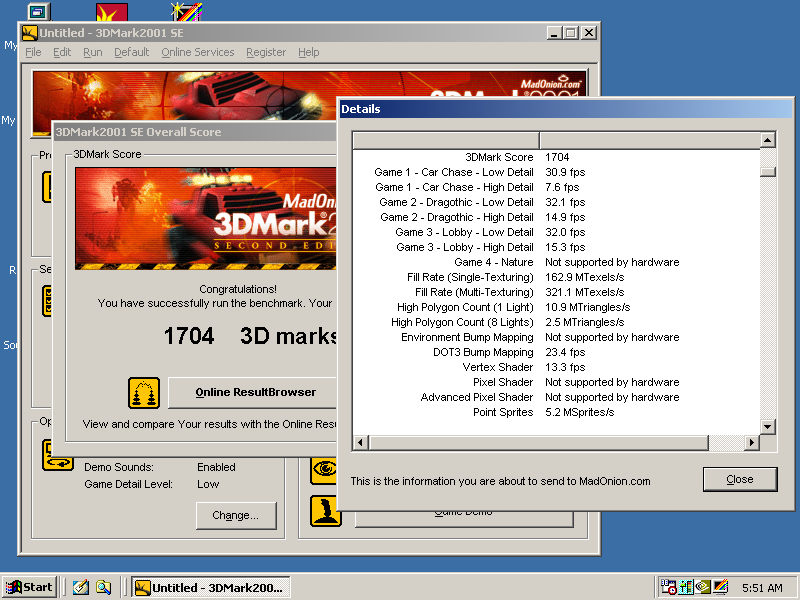
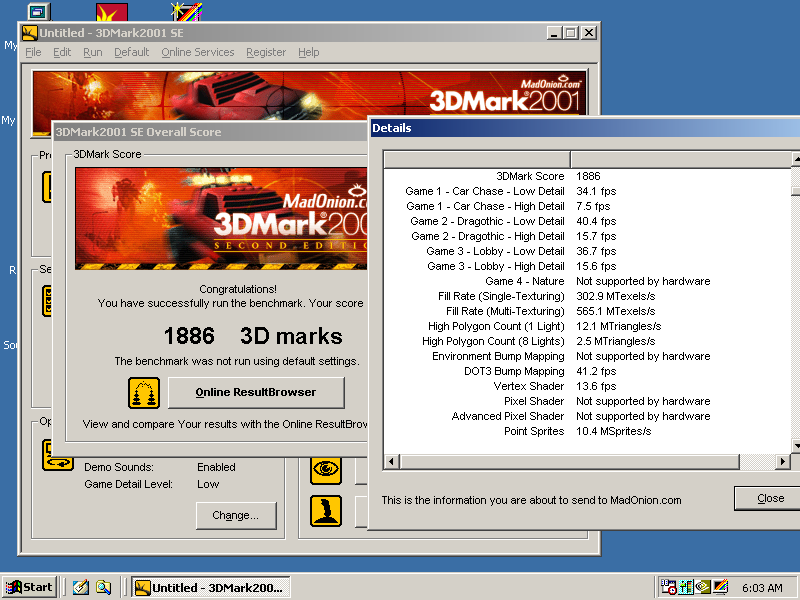
3DMARK 2001SE Benchmarks